Abstract
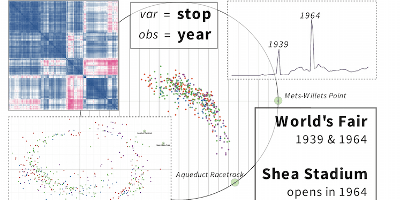
The degree of correlation between variables in a dataset is a key quantity in many data analysis applications. Correlation establishes the similarity between many variables and is often used by analysts as an exploratory tool to help form new hypotheses and sift through vast amounts of data in a variety of different domains. We present a novel technique: the spatial correlation scatterplot, or the s-CorrPlot. The s-CorrPlot scales to hundreds of thousands of variables, both computationally and visually. The s-CorrPlot encodes correlation exactly for selected variables.
Citation
Sean McKenna,
Miriah Meyer,
Christopher Gregg,
Samuel Gerber
s-CorrPlot: Encoding and Exploring Correlation
Proceedings of the IEEE Information Visualization Conference - Posters (InfoVis ’14), 2014.
BibTeX
@inproceedings{2014_infovis_s-corrplot,
  title = {s-CorrPlot: Encoding and Exploring Correlation},
  author = {Sean McKenna and Miriah Meyer and Christopher Gregg and Samuel Gerber},
  booktitle = {Proceedings of the IEEE Information Visualization Conference - Posters (InfoVis ’14)},
  year = {2014}
}